Showing posts with label QspatiaLite. Show all posts
Showing posts with label QspatiaLite. Show all posts
Sunday, September 20, 2015
QspatiaLite Use Case: Find Dominant Species and Species Count within Sampling Areas Using the QspatiaLite Plugin
This blogpost shows how to find the dominant species and species counts within sampling polygons. The Species-layer that I'll use here is comprised of overlapping polygons which represent the distribution of several species. The Regions-layer represents areas of interest over which we would like to calculate some measures like species count, dominant species and area occupied by the dominant species.
Since QGIS now makes import/export and querying of spatial data easy, we can use the spatiaLite engine to join the intersection of both layers to the region table and then aggregate this intersections by applying max- and count-function on each region. We'll also keep the identity and the area-value of the species with the largest intersecting area.
For the presented example I'll use
Regions, which is a polygon layer with a areas of interest
Species, which is a polygon layer with overlapping features, representing species
Do the calculation in 2 easy steps:
Import the layers to a spatiaLite DB with the Import function of the plugin (example data: HERE)
Run the query. For later use you can load this table to QGIS or export with the plugin's export button.
Addendum:
If you wish to calculate any other diversity measures, like Diversity- or Heterogenity-Indices, you might just run the below query (which actually is the subquery from above) and feed the resulting table to any statistic-software!
The output table will contain region's IDs, each intersecting species and the intersection area.
The intersection area, which is the species' area per polygon, is the metric that would be used for the calculation of diversity / heterogenity measures, etc. of regions!

I tested this on
QGIS 2.6 Brighton
with the QspatiaLite Plugin installed
Read more »
Since QGIS now makes import/export and querying of spatial data easy, we can use the spatiaLite engine to join the intersection of both layers to the region table and then aggregate this intersections by applying max- and count-function on each region. We'll also keep the identity and the area-value of the species with the largest intersecting area.
For the presented example I'll use
Do the calculation in 2 easy steps:
SELECT
  t.region AS region,
  t.species AS sp_dom,
  count(*) AS sp_number,
  max(t.sp_area) / 10000 AS sp_dom_area
  FROM (
      SELECT
          g.region AS region, s.species AS species,
          area(intersection(g.Geometry, s.Geometry)) AS sp_area
          FROM Regions AS g JOIN Sp_Distribution AS s
          ON INTERSECTS(g.Geometry, s.Geometry)
  ) AS t
GROUP BY t.region
ORDER BY t.region
Addendum:
If you wish to calculate any other diversity measures, like Diversity- or Heterogenity-Indices, you might just run the below query (which actually is the subquery from above) and feed the resulting table to any statistic-software!
The output table will contain region's IDs, each intersecting species and the intersection area.
The intersection area, which is the species' area per polygon, is the metric that would be used for the calculation of diversity / heterogenity measures, etc. of regions!
SELECT
  g.region AS regID,
  s.species AS sp,
  AREA(INTERSECTION(g.geometry, s.geometry)) AS sp_area
FROM Regions AS g JOIN Sp_Distribution AS s
ON INTERSECTS(g.Geometry,s.Geometry)
ORDER BY regID, sp_area ASC

I tested this on

QspatiaLite Use Case: Query for Species Richness within Search-Radius
Following up my previous blogpost on using SpatiaLite for the calculation of diversity metrics from spatial data, I'll add this SQL-query which counts unique species-names from the intersection of species polygons and a circle-buffer around centroids of an input grid. The species number within the bufferarea are joined to a newly created grid. I use a subquery which grabs only those cells from the rectangular input grid, for which the condition that the buffer-area around the grid-cell's centroid covers the species unioned polygons at least to 80%.
Example data is HERE. You can use the shipped qml-stylefile for the newly generated grid. It labels three grid-cells with the species counts for illustration.
Import grid- and Sp_distr-layers with QspatiaLite Plugin
Run query and choose option "Create spatial table and load in QGIS", mind to set "geom" as geometry column

Read more »
select
    g1.PKUID as gID,
    count (distinct s.species) as sp_num_inbu,
    g1.Geometry AS geom
from (
 select g.*
 from(select Gunion(geometry) as geom
           from Sp_distr) as u, grid as g
 where area(intersection(buffer(centroid(g.geometry), 500), u.geom)) > pow(500, 2)*pi()*0.8
) as g1 join Sp_distr as s on intersects(buffer(centroid( g1.Geometry), 500), s.Geometry)
group by gID

QspatiaLite Use Case: Connecting Lines
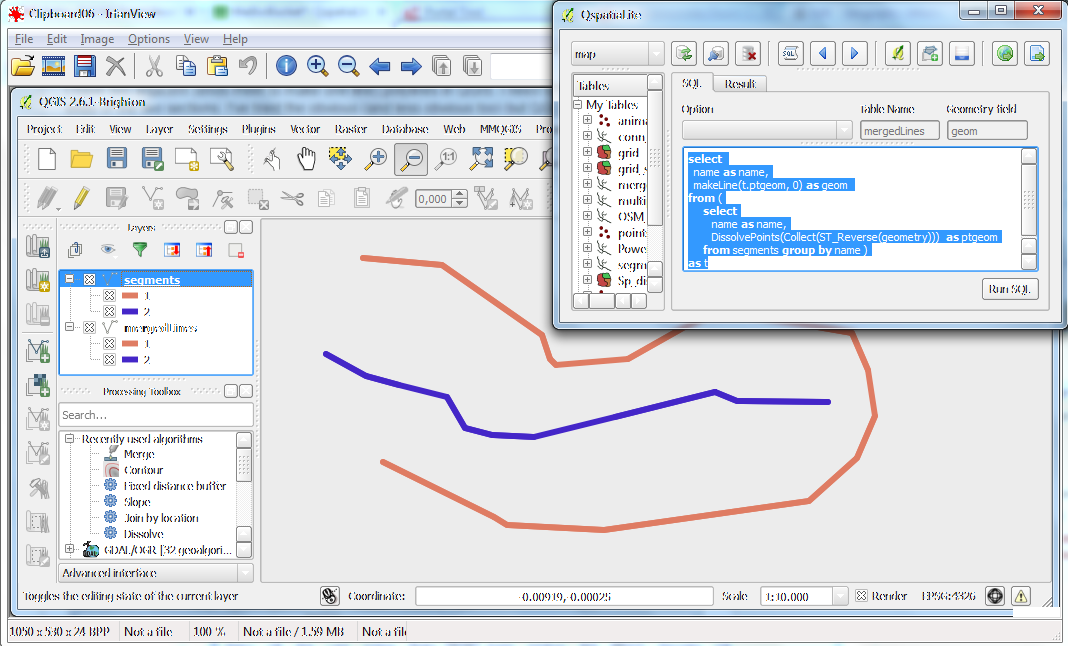
With QSpatiaLIte you can connect disjoint lines quite easily. With the below SQL you can allow for a grouping variable, in this case the field 'name' within the layer 'segments', by which the group vertices are collected and connected as lines! With this approach the vertices are connected in the order in which they were digitized and existing gaps are closed.


Read more »

select
  name as name,
  makeLine(t.ptgeom, 0) as geom
from (
     select
        name as name,
        DissolvePoints(Collect(ST_Reverse(geometry)))  as ptgeom
     from segments group by name )
as t
QspatiaLite Use Case: Connect Points with Same ID with Line Using the QspatiaLite Plugin
Another short example illustrating the effectiveness of geoprocessing with SpatiaLite, using the great QGIS-plugin QspatialLite.
We have a point-layer with an ID column ("Birds"), with each ID occuring twice, each ID representing an individual. The Ids should be used as start- & end-nodes for the connecting lines. Note that this also would apply if there were more than two points - then the same query could be used to connect all bird individual's points to a line by the order in each group!
We want each set of points, grouped by ID, to be connected. This is easily achieved by importing the points to a SpatiaLite-DB with the QspatiaLite plugin and running a very simple query:
Load the result to QGIS and that's it!

Read more »
SELECT
    ID,
    makeline(Geometry) AS geom
FROM Birds
GROUP BY ID

QspatiaLite Quicktip: Convert MULTILINESTRING to LINESTRING
One often encounters the problem, that after digitizing or running processing algorithms, the output geometry is MULTILINESTRING, but we rather wished to have the geometrytype LINESTRING. Until know I used a quite cumbersome, multistep workflow for conversion between these geometry-types - however, as we will see, all of this becomes ridicously easy with spatial SQL:
resulting in:
However, if your orginal line was something like MULTILINESTRING((-1 -1, 0 0), (0 0, 4 4))
you'd end up with:
which contains double vertices, which we certainly don't want!
So be aware, that the ordering / direction of the linestring will be as in the segments of the original layer! And as we saw, gaps between subsequent end-/startnodes will be closed in the new geometry!! It is adviseable to doublecheck before / after conversion!
If you deal with a multilinestring (or a combination of any type of linesstrings) which share end/startnodes nodes things are even easieruse this SQL:
resulting in:
Read more »
select
   replace(replace(replace(replace(replace(replace(astext(Collect(t.geometry)), 'MULTILINESTRING((','§'), '))', '%'), '(', ''), ')', ''), '§', 'LINESTRING('), '%', ')'
) as geom
from (
    select MultiLinestringFromText('MULTILINESTRING((-1 -1, 0 0), (1 1, 4 4))') as geometry
) as t
resulting in:
LINESTRING(-1 -1, 0 0, 1 1, 4 4)
However, if your orginal line was something like MULTILINESTRING((-1 -1, 0 0), (0 0, 4 4))
you'd end up with:
LINESTRING(-1 -1, 0 0, 0 0, 4 4)
which contains double vertices, which we certainly don't want!
So be aware, that the ordering / direction of the linestring will be as in the segments of the original layer! And as we saw, gaps between subsequent end-/startnodes will be closed in the new geometry!! It is adviseable to doublecheck before / after conversion!
If you deal with a multilinestring (or a combination of any type of linesstrings) which share end/startnodes nodes things are even easieruse this SQL:
SELECT AsText(Linemerge(MultiLinestringFromText('MULTILINESTRING((-1 -1, 0 0), (0 0, 4 4))')))
resulting in:
LINESTRING(-1 -1, 0 0, 4 4)
QspatiaLite Use Case: SpatiaLite Aggregation over Points within Polygons using the QspatiaLite Plugin
Here's a nice example for aggregation of points per polygon areas, which I grabbed from an Answer on SO, by user @Micha. The polygons could be regions of interest, a sampling grid, etc.
Say you want to do maximum, minimum, averages, etc. per polygon using the spatial database SpatiaLite.
You'll first need to import both of your layers into a spatialite DB, called "sensors" (the point layer) here, with a "pollution" column and "SHAPE1" (the polygons) with a "plgnID" column. You can do this easily with the QspatiaLite-plugin "Import" button (example data is HERE).
Now this query will give you various statistics from the sensors for each polygon:

Read more »
Say you want to do maximum, minimum, averages, etc. per polygon using the spatial database SpatiaLite.
SELECT g.plgnID AS "plgn_ID",
   AVG(s.pollution) AS "Average Pollution",
   MAX(s.pollution) AS "Maximum Pollution",
   COUNT(*) AS "Number of Sensors"
FROM sensors AS s JOIN SHAPE1 AS g
ON contains(g.geometry, s.geometry)
GROUP BY g.plgnID

QspatiaLite Use Case: Get Subselection of Grid which Covers Polygon
Here's another short SQL-query which I used to get a subselect from a rectengular grid. Aim is to keep only the grid-cells that fully cover the area of a second polygon-layer - cells which do not overlap the polygon's area completely will be skipped from the new grid-layer.

Read more »
select
  g.*
from(select Gunion(geometry) as geom
           from MYPLGN) as u, grid as g
where area(intersection(g.geometry, u.geom)) = area(g.geometry)

Saturday, September 19, 2015
QspatiaLite Use Case: SpatiaLite Aggregation over Intersections of Polygons with QspatiaLite Plugin
This applies to several usecases: Imagine you have a grid or polygon-layer of sampling areas and want to know the dominant feature of another polygon layer under each grid cell / sampling polygon - this could be soiltypes, landuse classes, etc. Other than the dominant feature you might be interested in the diversity of features (i.e. number of soils, etc.) per grid cell / sampling area.
QGIS alone does not provide handy tools for aggregation of features of one layer combined with other layers, but the spatiaLite engine is tailored for this! Since QGIS now makes import/export and querying of spatial data easy, it seems very worthy to dive into spatiaLite and utilize its powerful tools!
For the presented example I'll use:
SHAPE1, which is a polygon layer with a sampling grid/areas
Soils, which is a polygon layer with soiltypes
I tested this on
QGIS 2.6 Brighton
with the QspatiaLite Plugin installed

Import the above layers to a spatiaLite DB with the Import function of the plugin (example data: HERE)

Run the query and choose "create spatial table and load in QGIS" and put geom as geometry column! (I chose SHAPE2 as name for the newly created layer..)


That's it!
Read more »
QGIS alone does not provide handy tools for aggregation of features of one layer combined with other layers, but the spatiaLite engine is tailored for this! Since QGIS now makes import/export and querying of spatial data easy, it seems very worthy to dive into spatiaLite and utilize its powerful tools!
For the presented example I'll use:
I tested this on


SELECT t.geom AS geom,
    t.plgnID AS plgnID,
    t.soiltype AS soiltype,
    max(t.soil_area) AS MaxArea, count () AS n_soiltypes
       FROM (SELECT
          g.Geometry AS geom, g.plgnID AS plgnID, s.Soiltype AS soiltype,
          AREA(INTERSECTION(g.geometryO, s.geometry)) AS soil_area
          FROM SHAPE1 AS g JOIN Soils AS s
          ON INTERSECTS(g.Geometry,s.Geometry)
       ) AS t
GROUP BY t.plgnID
ORDER BY t.plgnID

QspatiaLite Use Case: Find Number of Species from Point Data
Here's a short follow up on some previous posting about the use of QspatiaLite for the aggregation of species distribution data. In this case the species data comes as a point layer. For each cell of a 1000 x 1000 m grid (1) the number of individuals per species, (2) the total number of individuals and (3) the number of different species should be calculated.
There is a layer with 10 different species (variabel name is "sp") across the whole extent with names "1", "2", "3", .. , "10" and a layer with the grid cells (variable name = "id") numbered consecutively, from 1 to 150.
In the attribute table of the below screenshot you see that I selected the grid cell with id=1 and the points (=species) within this cell. There are 8 individuals - "4", "5", "6" and "10" occure once, whereas "2" and "8" occure twice.
The query table in the screenshot is the result for (3).

For (1) you have to query for points/species within grid cells and group over grid cells and species and take the count from that aggregation
For (2) you simple need to query for points/species within grid cells and aggregate over grid cells:
For (3) you'll first need to aggregate over grid cells and points/species, and then again aggregate over this query table by grid cells which will finally give you the distinct species!
Read more »
There is a layer with 10 different species (variabel name is "sp") across the whole extent with names "1", "2", "3", .. , "10" and a layer with the grid cells (variable name = "id") numbered consecutively, from 1 to 150.
In the attribute table of the below screenshot you see that I selected the grid cell with id=1 and the points (=species) within this cell. There are 8 individuals - "4", "5", "6" and "10" occure once, whereas "2" and "8" occure twice.
The query table in the screenshot is the result for (3).

For (1) you have to query for points/species within grid cells and group over grid cells and species and take the count from that aggregation
SELECT
 t.gID AS gID,
 t.sp AS Sp,
 count(*) AS NrIndSp
FROM (SELECT
  g.id AS gID,
  s.sp AS sp
FROM grid AS g JOIN Sp_distr AS s
ON within(s.Geometry, g.Geometry)
) as t GROUP BY t.gId, t.sp
For (2) you simple need to query for points/species within grid cells and aggregate over grid cells:
Select
 t.gID,
 count(*) as NrInd
From (SELECT
  g.id AS gID,
  s.sp AS sp
FROM grid AS g JOIN Sp_distr AS s
ON within(s.Geometry, g.Geometry)
) as t
GROUP BY t.gID
ORDER BY t.gID
For (3) you'll first need to aggregate over grid cells and points/species, and then again aggregate over this query table by grid cells which will finally give you the distinct species!
SELECT
 v.gID,
 count(*) AS SpNr
FROM (SELECT
 t.gID,
 t.sp
FROM (SELECT
  g.id AS gID,
  s.sp AS sp
FROM grid AS g JOIN Sp_distr AS s
ON within(s.Geometry, g.Geometry)
) as t GROUP BY t.gId, t.sp
) as v GROUP BY v.gId
Subscribe to:
Posts (Atom)